Bring Professional Data Visualization to Godot with DataViz-UI.
by Jettelly
Published |
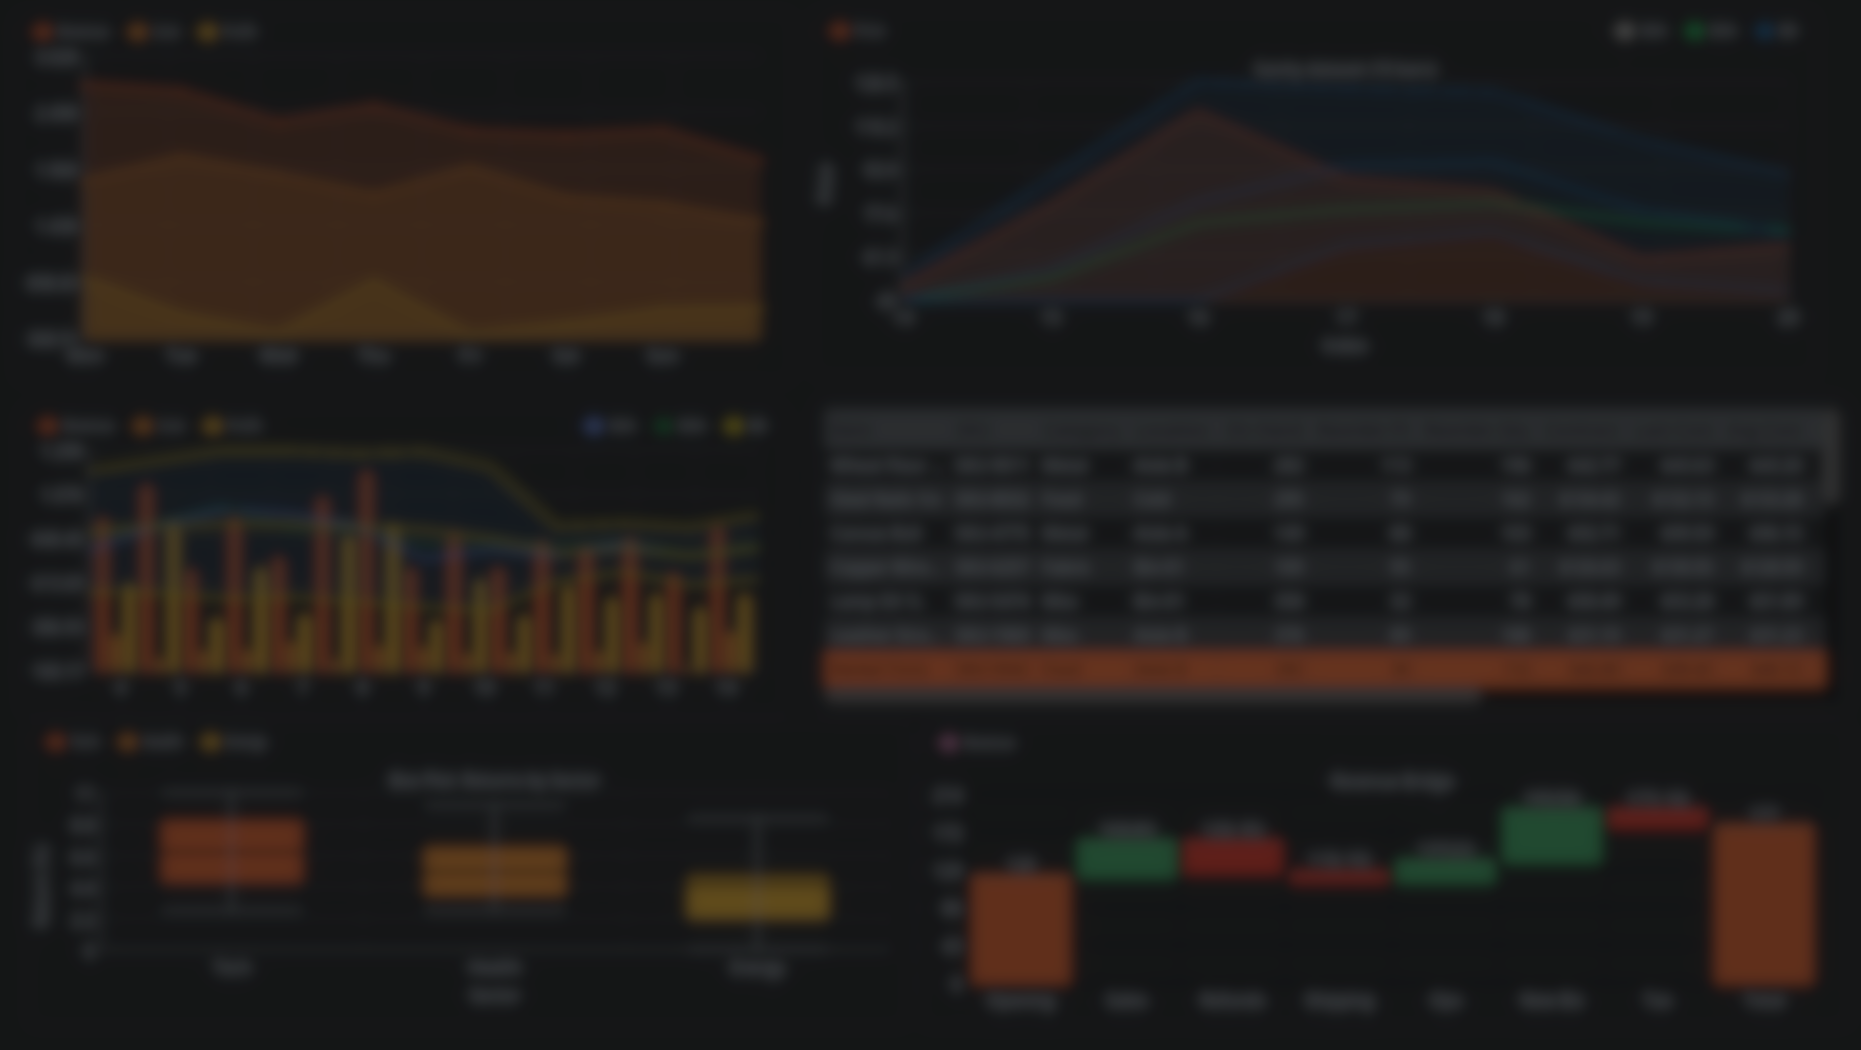
Godot keeps growing as a platform for simulations, strategy games, and system-heavy projects. But one recurring challenge remains: making good dashboards. DataViz-UI, a modular visualization toolkit for Godot 4.5+, addresses that problem with a clean API, editor integration, and theme-aware UI components.
It’s not just "charts for Godot." It’s a full solution for building dashboards, analytics panels, debug interfaces, and in-game data visualizations that feel native to the engine.
What This Tool Does
Instead of just providing charts, DataViz-UI actually gives developers a workflow to build responsive visualizations:
- Every component receives data through simple script calls, not complex setup.
- Values update live, perfect for debugging AI, economy systems, player behavior, or balancing tools.
- The system emits interaction signals (hover, click, selection), which lets you turn charts into UI controls..
- All charts respect Godot Themes, so visuals stay consistent across your entire UI.
And because the whole toolkit runs on C++ GDExtension, it’s performant enough for real-time dashboards in management games, RTS titles, and large-scale simulations.
While the store page highlights the components, the documentation shows interaction patterns that change how you use the add-on. Here are a few standouts.
1. Bar Charts That Behave Like UI Controls
Bar charts aren’t static images. They support category/series clicks, hover states, stacked modes, and spacing control.
extends DV_BarChart

func _ready() -> void:
	set_categories(["Desktop", "Tablet", "Mobile"])
	add_series("Active Users", PackedFloat32Array([5204.0, 1510.0, 2490.0]))
	add_series("Subscriptions", PackedFloat32Array([1400.0, 600.0, 950.0]))

	set_gaps(16.0, 6.0)
	set_stacked(false)

	bar_clicked.connect(_on_bar_clicked)
	bar_hovered.connect(_on_bar_hovered)

func _on_bar_clicked(series_idx: int, category_idx: int, value: float) -> void:
	var label := get_categories()[category_idx]
	print("Clicked", label, "series", series_idx, "=", value)

func _on_bar_hovered(series_idx: int, category_idx: int, value: float) -> void:
	var label := get_categories()[category_idx]
	print("Hover", label, "series", series_idx, "=", value)
This is ideal for:
- Inspecting simulation values
- Showing breakdowns when clicking a category
- Turning charts into menu elements (e.g., selecting an item type or region)
2. Box Plots With Automatic Statistics
The Box Plot computes quartiles, whiskers, medians, and outliers automatically. For games that simulate stats, loot variance, NPC performance, or progression curves, this is extremely useful.
extends DV_BoxPlot

func _ready() -> void:
    set_title("Quarterly Returns")
    set_y_axis_label("% Delta")
    set_categories(["Tech", "Health", "Energy"])

    add_series("Tech", PackedFloat32Array([2, 5, 7, 1, 9, 4, 6, 8, 3, 10]))
    add_series("Health", PackedFloat32Array([1, 2, 2, 3, 4, 4, 5, 6, 7, 9]))
    add_series("Energy", PackedFloat32Array([-2, 0, 1, 3, 3, 4, 8]))

    set_show_outliers(true)
    set_gap_group(12.0)
    set_box_width_frac(0.55)

    box_clicked.connect(_on_box_clicked)

func _on_box_clicked(group_idx: int, median: float) -> void:
    print("Median for", get_categories()[group_idx], "=", median)
3. Line Charts With SMA/EMA/Bollinger Overlays
This is a feature normally found in finance tools, but you can use it to visualize:
- Difficulty curves
- Player progression trends
- Economy smoothing
- Resource production over time
extends DV_LineChart

func _ready() -> void:
	set_value_format(DVComponent.DECIMAL)

	set_show_points(false)
	var P := PackedFloat32Array([30,35,40,50,80,115,90,85,60,65])
	set_categories(PackedStringArray(["11","12","13","14","15","16","17","18","19","20"]))
	set_index_range(3, 10)

	set_title("Sanity dataset (10 bars)")
	set_y_axis_label("Price")
	set_x_axis_label("Index")

	# Use short windows so overlays are visible on 10 bars
	var mask :int = DVChart.OVL_SMA | DVChart.OVL_EMA | DVChart.OVL_BBANDS
	var s_price := add_series_with_overlays("Price", P, mask, 3, 5, 3, 2.0)
	set_series_filled(s_price,true)
	# Give each overlay its own style (don’t re-override with set_series_overlay_style)
	set_series_sma_style(s_price, Color8(200,200,200), 2.0)
	set_series_ema_style(s_price, Color8( 46,204,113), 2.0)
	set_series_bbands_style(s_price, Color8(41,128,185), Color(0.16,0.5,0.83,0.12), 2.0)
4. Timeline Tracks for Story, Quests, or Production Schedules
The Timeline component is basically a mini-Gantt chart. Great for:
- Narrative editors
- Simulation schedules
- Production lines
- Procedural quest systems
extends DV_Timeline

func _ready() -> void:
    set_show_grid(true)
    set_grid_step(60.0)

    var main_track := add_track("Main Story")
    var side_track := add_track("Contracts")

    add_event(main_track, 0.0, 240.0, "Prologue", Color(0.24, 0.56, 0.85), {})
    add_event(main_track, 240.0, 540.0, "Siege", Color(0.78, 0.32, 0.28), {})
    add_event(main_track, 540.0, 720.0, "Council", Color(0.32, 0.75, 0.45), {})

    add_event(side_track, 120.0, 300.0, "Gather Intel", Color(0.58, 0.5, 0.82), {})
    add_event(side_track, 360.0, 480.0, "Escort Caravan", Color(0.4, 0.65, 0.92), {})

    set_time_range(0.0, 720.0)
    set_now_enabled(true)
    set_now_time(360.0)

    event_clicked.connect(_on_event_clicked)

func _on_event_clicked(track: int, index: int, start: float, end: float, label: String, meta: Dictionary) -> void:
    print("Clicked", label, "from", start, "to", end)
5. Waterfall Charts for Economy, Cash Flow, or Resource Pipelines
This is useful for tycoon and management games. A waterfall chart shows how each positive/negative factor contributes to a final value, perfect for:
- Daily income breakdown
- Resource deltas
- Balance analysis
- Player financial feedback
The included demo uses these charts in a full “store simulator,” as a real-world example.
extends DV_Waterfall

func _ready() -> void:
    set_title("Monthly Cash Flow")
    set_bar_gap_px(8.0)
    set_value_format(DVComponent.COMPACT)

    var labels := PackedStringArray([
        "Starting Balance",
        "Sales",
        "Refunds",
        "Logistics",
        "Marketing",
        "Subscriptions",
        "Taxes"
    ])

    var deltas := PackedFloat32Array([120000.0, 45000.0, -12000.0, -8000.0, -5000.0, 22000.0, -18000.0])
    set_categories(labels)
    add_series("Δ Cash", deltas)

    set_show_value_labels(true)
Why This Tool Matters
Instead of having to create debug dashboards using Control nodes and Line2D hacks. DataViz-UI can handle all of that:
- No need for custom drawing logic
- No need for manual scaling or labels
- No need to compute statistics
- No need for handmade economy charts
Similar and Useful Tools
- Easy Charts (4.x): A Godot Asset Library addon that provides a collection of simple 2D and 3D chart nodes for Godot, allowing you to create basic charts like line, bar, and pie graphs using Control nodes and 3D visuals.
Differences: Easy Charts offers straightforward chart creation with minimal setup, making it ideal for basic visual needs. DataViz UI is more advanced and modular, with theme integration, gauges, dashboards and editor-ready tools for richer, production-level UI analytics.
- Godot-DataView UI Control: An open-source UI control for Godot that displays large amounts of data efficiently, suitable for tables or scrollable data views in UI panels.
Differences: Godot-DataView focuses on data display in tabular or large lists rather than visual charts and interactive dashboards. DataViz UI provides graphical chart widgets (line, bar, pie, gauge), making it better for visual analytics; dataview is better for raw data lists or table views.
✨ DataViz UI is now available on the author’s itch-io page.
📘 Interested in creating your own Tools and Shaders? Check out the Godot Shaders & Blender Tools Bundle, which includes: Blender Tool Development Fundamentals and The Godot Shaders Bible.
📘 Interested in creating your own Tools and Shaders? Check out the Godot Shaders & Blender Tools Bundle, which includes: Blender Tool Development Fundamentals and The Godot Shaders Bible.
Our best-selling indie Bundle: Godot shaders + Blender tools ✨ https://t.co/zSlHDCuGVC#b3d #GodotEngine #3DCG pic.twitter.com/sjdYxXjKUB
— The Unity Shaders Bible (@ushadersbible) November 16, 2025
Other posts that might interest you.
-
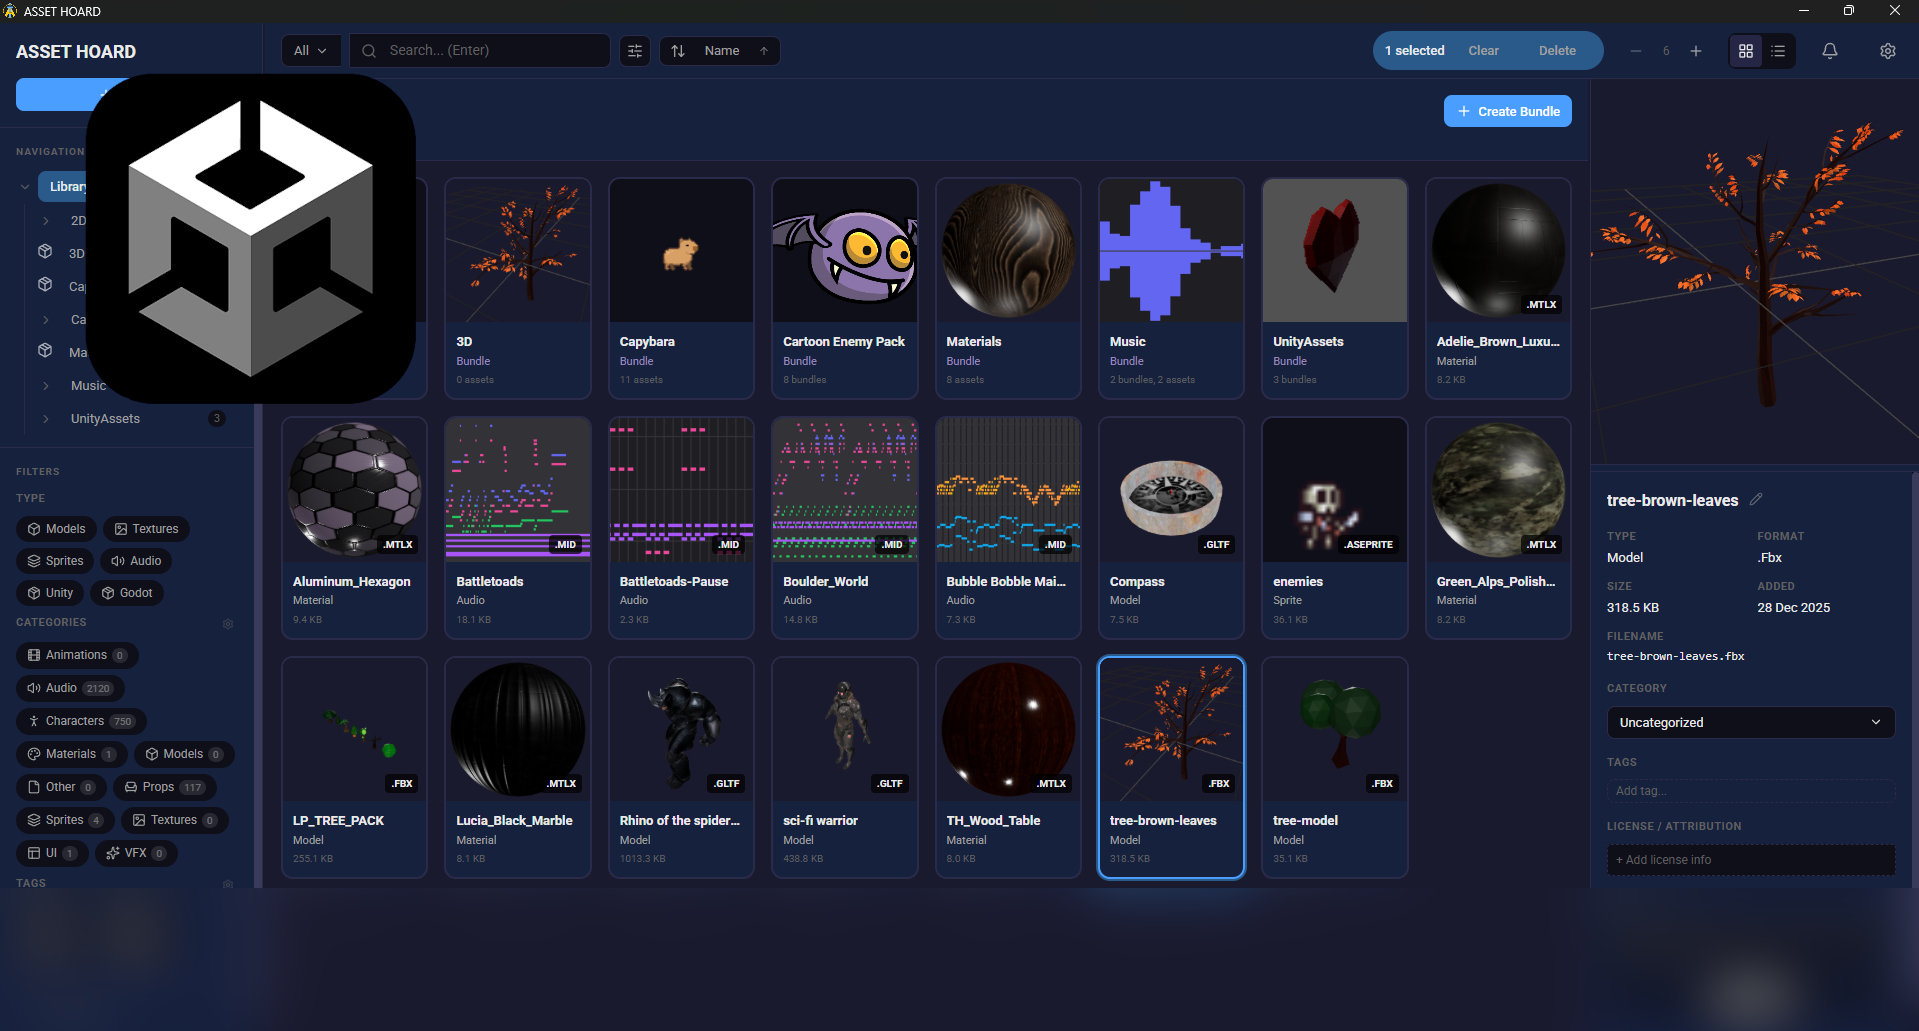 We take a look at AssetHoard, a local-first asset manager designed to organize and preview game assets, with workflows for engines like Unity and Godot.
 -
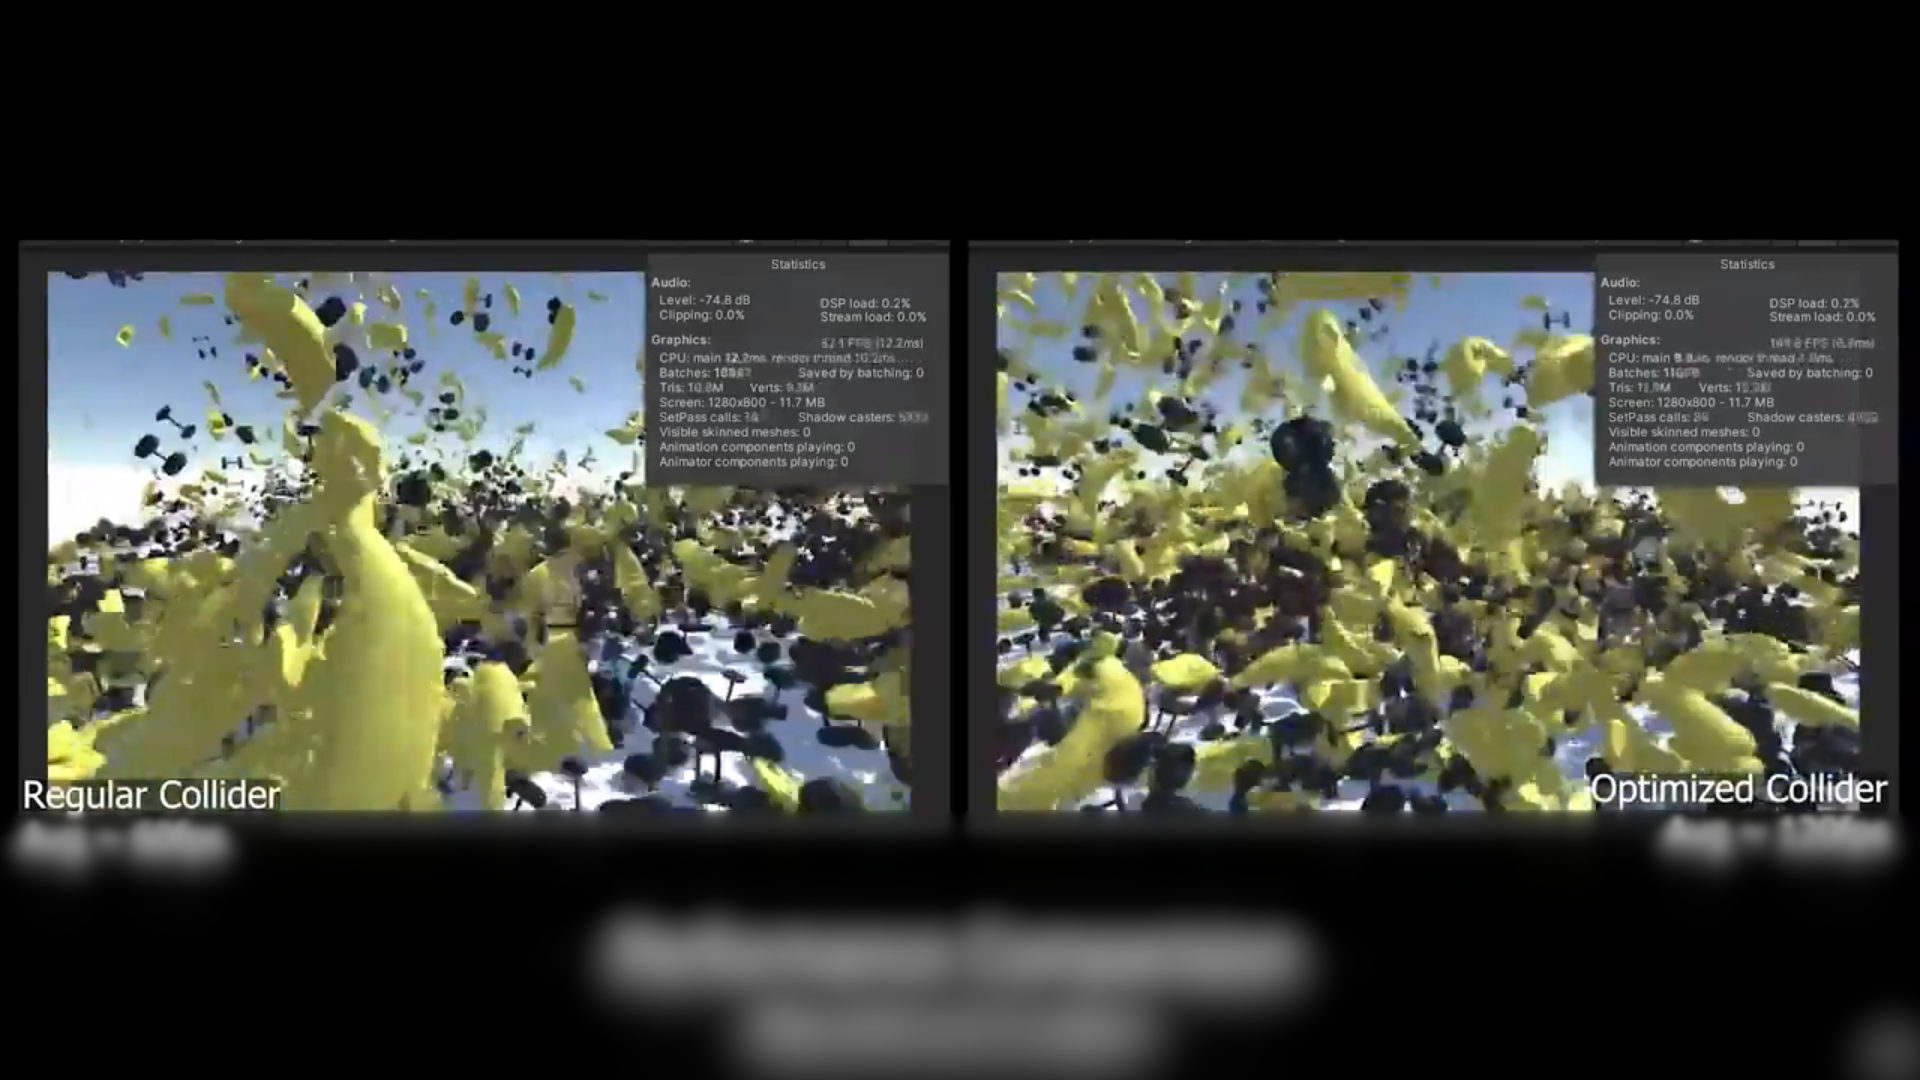 We take a look at a free, open-source Unity tool that reduces MeshCollider and PolygonCollider2D complexity to improve physics performance without rebuilding assets.
 -
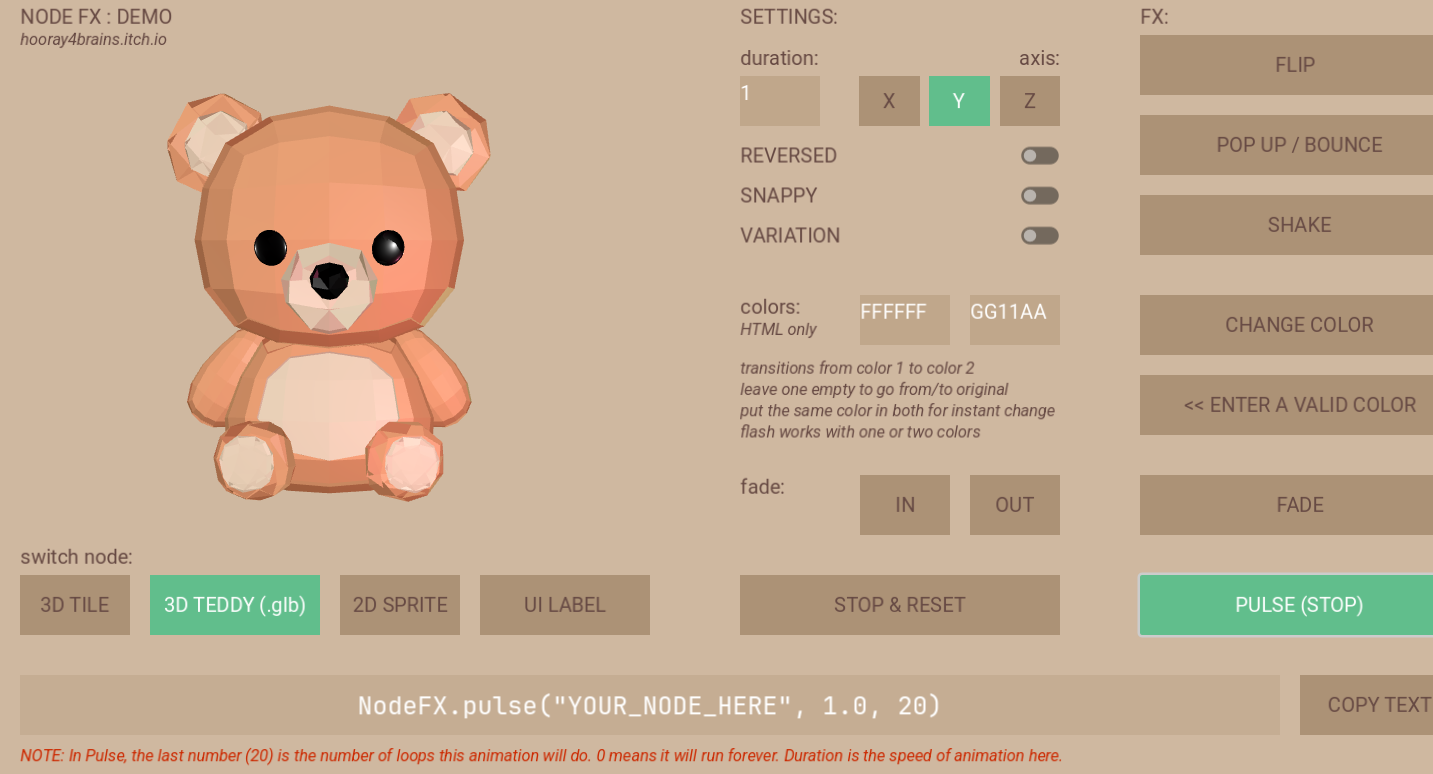 We show a demo/WIP for a library for simple procedural animations with less code.