Debug Graph: Visualizing Runtime Data in the Godot Editor.
by Vicente C.
Published |
10
Debugging gameplay often means printing values to the console and trying to make sense of a stream of numbers.
That works for simple cases, but it quickly becomes difficult when you want to understand how a value changes over time.
Debug Graph replaces those numbers with a live graph in the editor. You only need to call DebugGraph.plot("label", value) to start recording any float value.
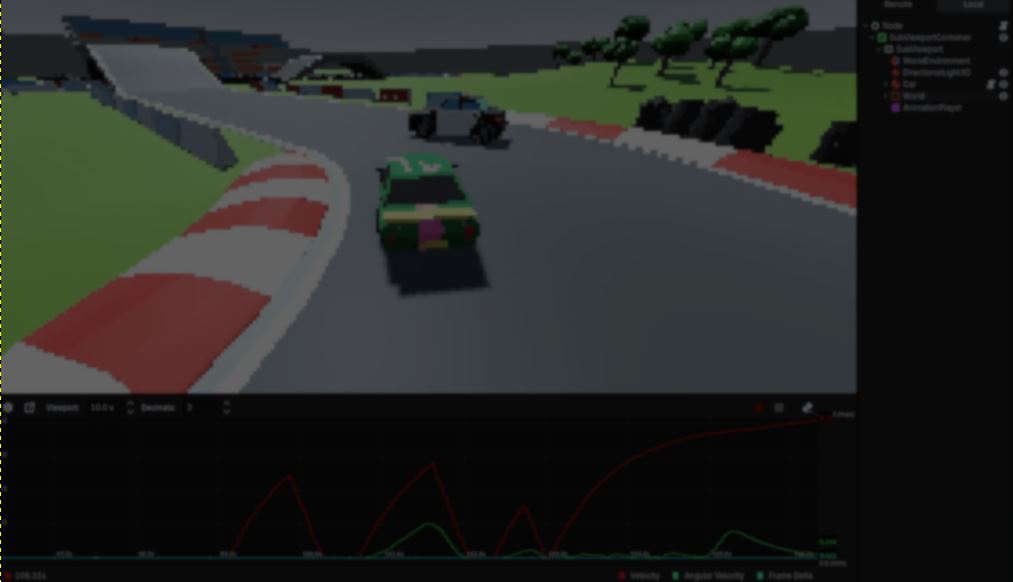
He wanted to see exactly how each jump affected the player's speed, and a graph made those changes much easier to understand than reading values in the console.
The red track records the player's horizontal velocity, while the green track shows the vertical speed. Together they make it easy to see how much speed each bunny hop adds.
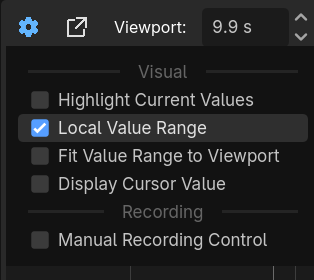
When comparing values with very different ranges, Local Value Range gives each track its own scale. That makes smaller changes much easier to spot without losing the recorded values under the cursor.
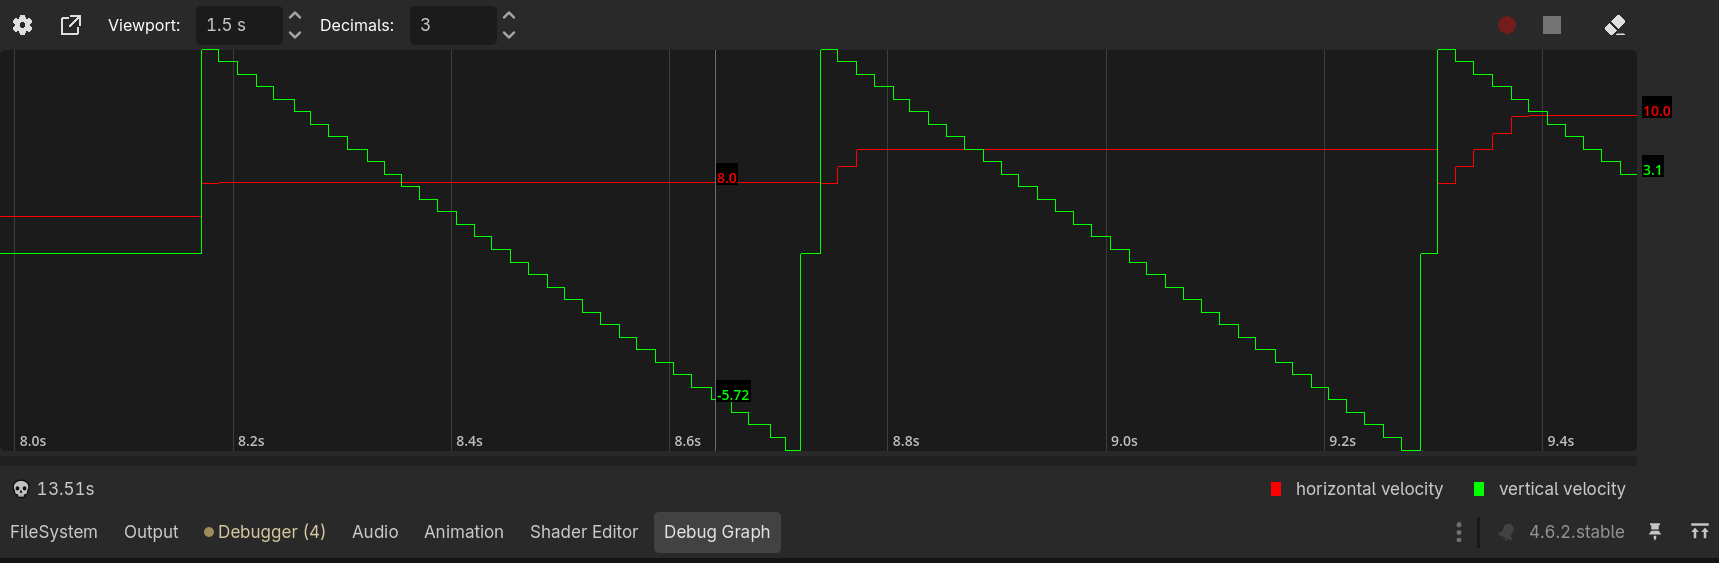
Zooming in makes the sampling rate visible.
Since these values were recorded in _physics_process(), the graph contains 60 samples per second. Recording in _process() can capture even more detail, although Nathan notes that higher sampling rates also increase the performance cost.
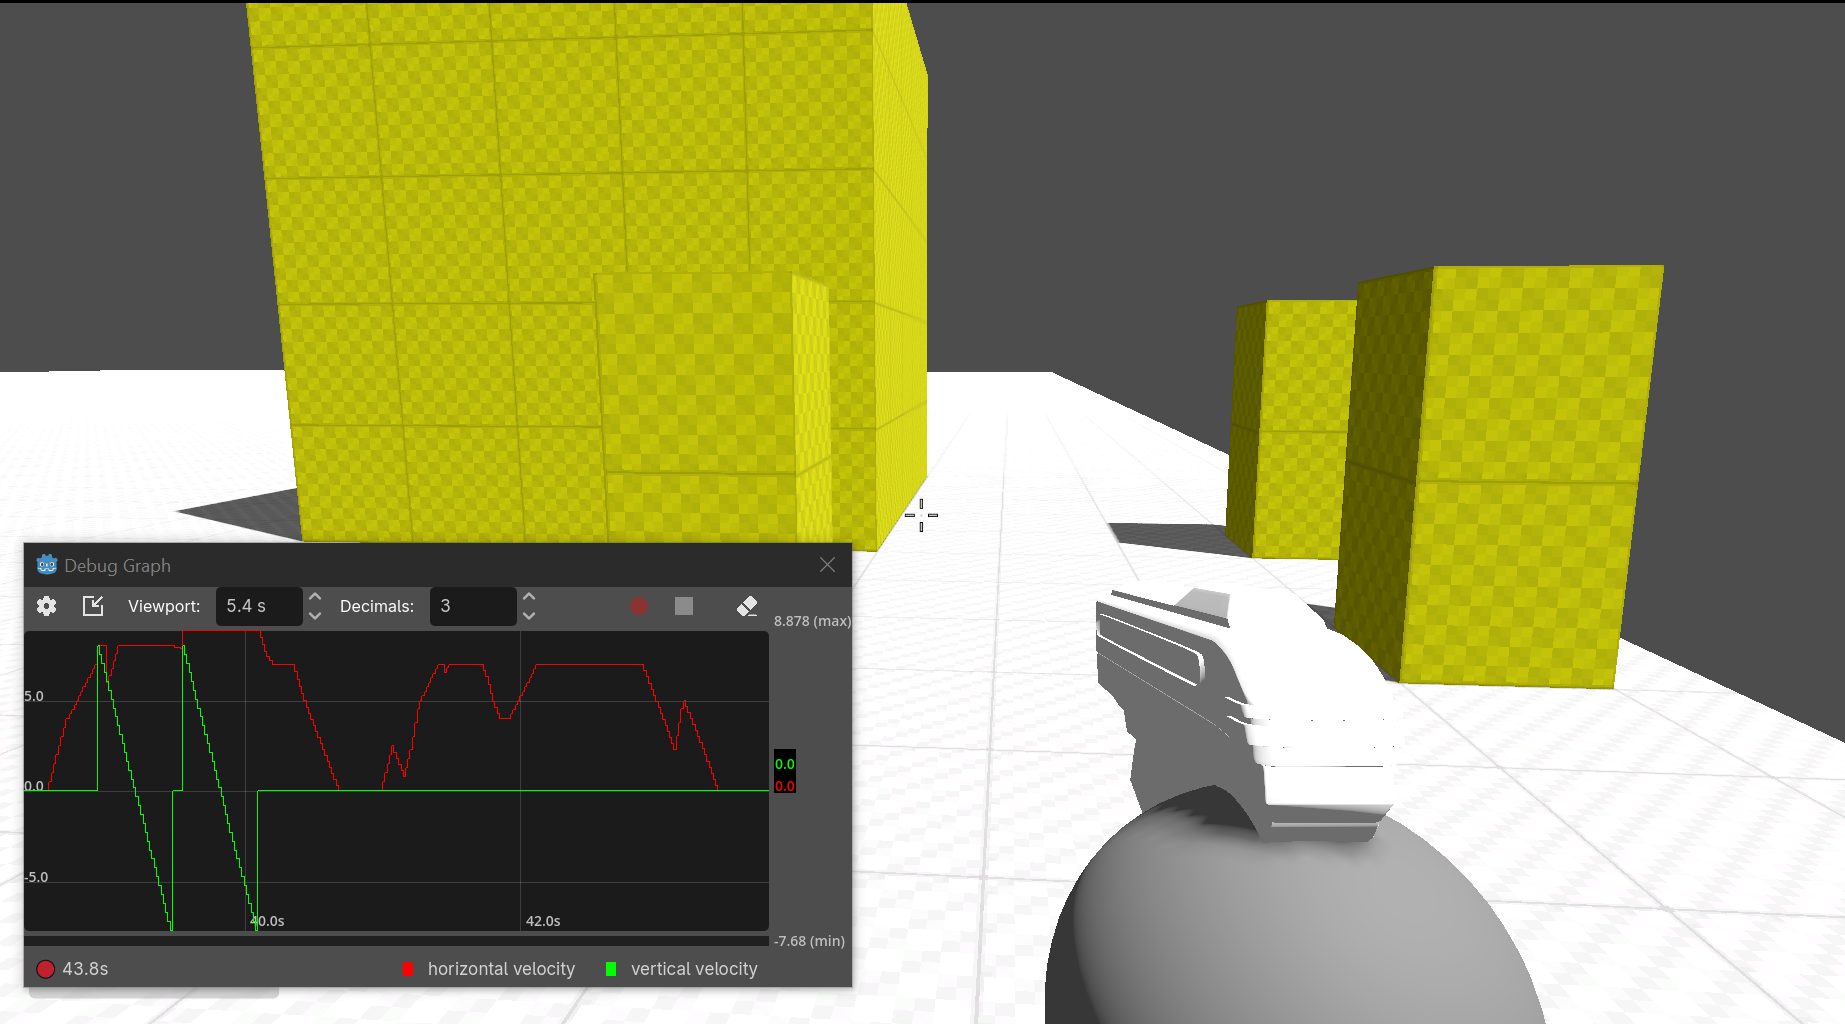
The graph can be detached into its own window, making it easier to monitor values while playing the game in fullscreen.
When working with multiple instances of the same object, each graph is identified by its label. Reusing the same label updates the existing track, while unique labels make it possible to monitor every instance on its own.
DebugGraph.plot("horizontal velocity", Vector2(owner.velocity.x, owner.velocity.z).length())
DebugGraph.plot("vertical velocity", owner.velocity.y)
This example records the player's horizontal and vertical velocity as two separate tracks.
Nathan draws the graph using Godot's _draw() function, scaling the recorded values to the current viewport and zoom level.
According to Nathan, sending the data from the running game to an editor dock was one of the hardest parts of the project. He uses Godot's EditorDebuggerPlugin to send it.
If you want to learn more or try Debug Graph yourself, the links will be right below.
- Godot Asset Library: https://store.godotengine.org/asset/jeditor/debug-graph/
- Itch.io: https://jeditor.itch.io/
Learn more! 📖
If you want to learn more about shaders in Godot, The Godot Shaders Bible covers topics like stylized shading, screen-space VFX, lighting, and vertex manipulation through step-by-step examples.
Some gems you can find in the Godot Shaders Bible book ✨ https://t.co/1kYkAqSE2L pic.twitter.com/bHVR4yEKSU
— Shaders Bible Series (@ushadersbible) June 25, 2026
Jettelly wishes you success in your professional career!
Did you find an error? No worries!
Write to us at [email protected], and we'll fix it!
Level up your Technical Art skills in Godot!
We invite you to explore "The Godot Shaders Bible", a comprehensive book on the concepts and fundamentals seen in this post.
Other posts that might interest you.
-
 Gameplay programmer Agustin Rosso open-sourced RossoForge, a modular Unity ecosystem with reusable packages for game flow, UI, pooling, events, and other common Unity systems.
 -
 Godot 4.7 has now entered beta, bringing HDR support, a new Asset Store, rendering improvements, and additional tools for level creation and shader development.
 -
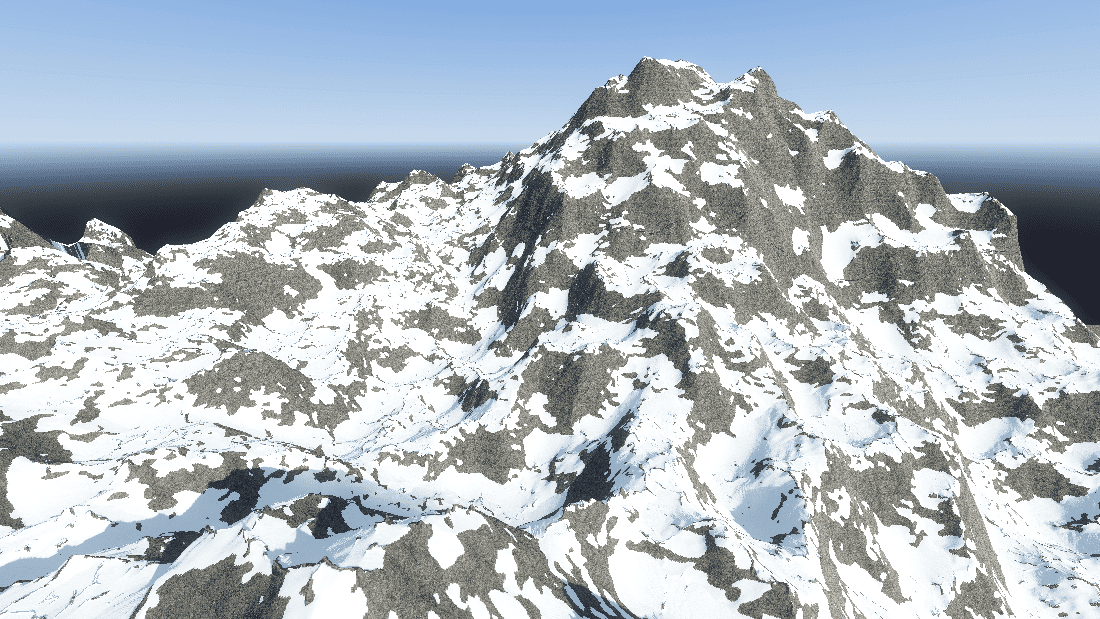 Check out SimpleXTerrain, a free and open-source node-based world generator for Godot 4 made by Prajwal.